Advanced Company Valuation Ratios Certification
Understanding Price-to-Earnings, EV/EBITDA, and Other Valuation Ratios
Learn Advanced Company Valuation Ratios Certification
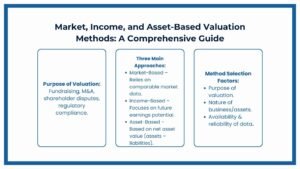
Valuation ratios are one of the most powerful tools of analysis in the world of finance. They let investors, analysts, and business owners compare companies, evaluate market expectations and measure financial performance in a short time. Ratios such as Price / Earnings (P/E), Enterprise Value / Earnings Before Interest and Taxes (EV/EBITDA) and Price / Sales (P/S) are snapshots that allow us to get a quick glimpse of market valuations for businesses based on their earnings, cash flow or revenue. Ratios like Price-to-Earnings (P/E), Enterprise Value-to-EBITDA (EV/EBITDA), and Price-to-Sales (P/S) act as quick snapshots of a company’s market valuation relative to earnings, cash flows, or revenue.
While these ratios are quite straight forward in appearance, there are a great deal of implications behind them. Once you understand them properly, a company’s indicators may indicate if it’s priced too high, too low, or, on the basis of its future growth prospects and risk of failure. A single ratio cannot capture the full financial health of a company, but when combined with other metrics, it helps to uncover insights about growth prospects, risk levels, and overall market sentiment. For instance, a company with a high P/E ratio may indicate investor confidence in future growth, whereas a low P/E may signal undervaluation or potential risk.
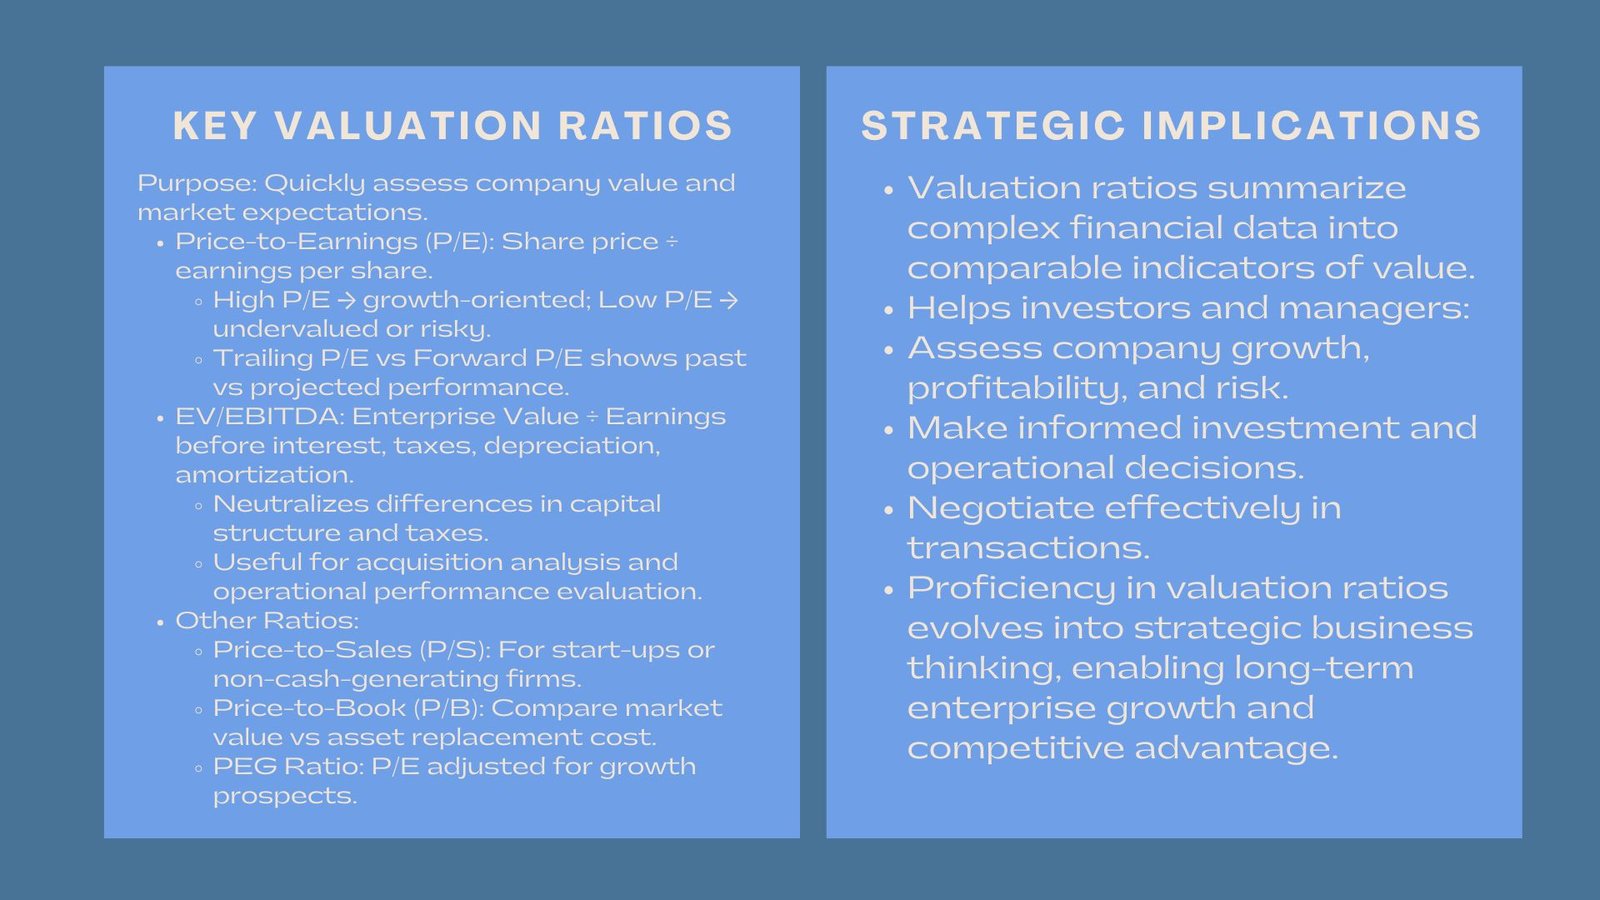
Price-to-Earnings (P/E) Ratio
The P/E ratio is used to compare the share price with the earnings per share (EPS) of a company. It shows the level of investment which investors are willing to pay for one dollar of earnings today. High P/E ratios tend to be growth-oriented and low ratios tend to be more undervalued or risky.
However, the P/E ratio has to be put into perspective in the industry. A fast growing technology company may have a P/E of 30, while the same company after 10 years will only have a PE of 10, assuming their cash flows remain stable. Analysts also distinguish between trailing P/E (based on past earnings) and forward P/E (based on projected earnings), allowing for a comparison between historical performance and anticipated growth. Proper interpretation of P/E ratios enables investors to assess whether the market is pricing a company fairly relative to its earnings potential.
Enterprise Value-to-EBITDA (EV/EBITDA)
The EV/EBITDA ratio is popular with investors as it neutralizes the dissimilarities in capital structure and tax regimes. Enterprise Value (EV) is the aggregate value of the firm value, which includes debt and equity whereas understanding price-to-earnings and EV/EBITDA valuation ratios is the operational profitability excluding interest, taxes, depreciation, and amortization.
A low EV(EPS)/EBITDA multiple may indicate an undervalued company but it is the industry norms and growth potential that helps in interpreting the figure. In acquisition analysis, this ratio is useful in judging the purchase price as it is justified by future income potential. . For example, if a manufacturing firm has an EV/EBITDA of 5 while industry peers are at 8, the lower multiple may signal a potential acquisition opportunity—but only if the company’s operational performance, market position, and growth prospects align with expectations.
Other Key Ratios
P/S: This is a good indicator of worth for a company that is either in its start-up phase or is not generating any cash.
Price-to-Book (P/B): The price to book ratio shows whether the valuation of a firm’s assets is considered above their replacement cost or below their replacement cost.
PEG Ratio: this normalizes P/E for growth, a more complex way of looking at value.
Used together those ratios create a multi-dimensioned picture of how to use financial ratios for company valuation analysis and investor sentiment.
When used together, these ratios provide a multi-dimensional picture of company performance, investor sentiment, and potential risk, allowing analysts and executives to make informed decisions.
Conclusion
Valuation ratios are still the basis of modern financial analysis. They summarize abstract financial information into easily understood, comparable indicators of value. However, their real strength is their interpretation – what the numbers are telling us about a company’s growth, profitability and risk. Hence, understanding valuation ratios helps investors, executives, and managers alike make better decisions, negotiate at the negotiating table, anticipate future scenarios, etc. In today’s data-driven economy, anyone with an understanding of valuation can make an opportunity spot and avoid expensive errors.
The development of variant valuation metrics over time turns into not only a knack for keen analytics but an essential component of the strategic thinking executive role – where monetary understanding is transformed into continued enterprise worth. Over time, proficiency in valuation metrics evolves from a technical skill into a core component of strategic business thinking, enabling financial insights to translate into long-term enterprise growth and sustainable competitive advantage.