How Are Technology Companies Valued?
A practical guide for junior to mid-level finance professionals

Understanding How Are Technology Companies Valued?
It can be difficult to grasp the idea of what a technology business is worth when you see the headlines about billion-dollar startups with no profits, or software businesses trading at multiples of the hundreds of times the company’s annual revenue. However, tech company valuation isn’t a random act — it’s a methodical process, based on financial analysis, market context and forward-looking thinking. No matter you are a junior analyst creating your first model, or a job seeker wanting to understand investor and acquirer thinking regarding the valuation of technology businesses, understanding how investors and acquirers consider valuating a technology company is one of the most useful skills you can learn. This article explains the major techniques, practical reasoning and some typical pitfalls used to arrive at a number in the industry.
Key Takeaways
| ✦ | For tech companies, the first step in valuation is typically through revenue multiples, as a great example, for a high-growth or pre-profit company. |
| ✦ | For companies in their growth phases or when prospective buyers are considering acquisitions, profitability indicators such as EBITDA become more important to consider. |
| ✦ | The three most important factors in determining a company’s multiple are the growth rate, gross margin and the quality of the company’s revenue. |
| ✦ | The two main market-based methodologies which are used are comparable company analysis and precedent transactions. |
| ✦ | While theoretically sound, discounted cash flow analysis is very dependent on assumptions and should be viewed as a supporting, not a anchoring tool. |
What Methods Do Analysts Actually Use to Value a Tech Company?
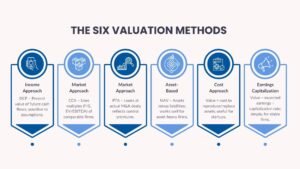
The three basic valuation models that professionals are likely to discuss when valuing tech companies are comparable company analysis (or “comps”), precedent transaction analysis, and discounted cash flow (DCF) analysis. All three methods reflect a different aspect of value and in practice, each of these is executed and a range is triangulated.
Comparable company analysis is the process of identifying similar technology companies, in terms of business model, size, growth and end market, that are publicly traded. The analyst then derives valuation multiples of those peers (usually Enterprise Value over Revenue (EV/Revenue) or Enterprise Value over EBITDA (EV/EBITDA) and applies the appropriate range to the company being assessed. This is a straightforward argument: if businesses that are similar trade at $8-12 per revenue, then so should your business, if it has similar attributes.
The concept is the same as precedent transaction analysis, except that instead of relying on the current multiple on public market trading, analysis of what companies similar to the target have been acquired for in past transactions. I think one of the reasons that precedent transaction multiples are higher than the similar company multiples is that in acquisitions, there’s a control premium, which is an amount paid to get control. In practice, this is important – precedent transactions will provide you with a more positive anchor than public market comps if you are doing your materials for a potential sale process.
Why Do Revenue Multiples Matter More Than Profits for Tech Firms?
One of the first things that comes to mind for newbies to the business is that often it is not profit that makes the news when it comes to the stock market for tech firms. There are instances of a software company with revenue of $50 million that is using $10 million annually and still worth more than $300 million. The answer is related to the business model economics and investors’ preference for future earning possibility to their current return.
Software companies, especially, have very high gross margins, typically in the range of 70-85 per cent, such that a significant amount of incremental revenue often goes into profit. Investors, then, take it on the chin now in the hope of huge margins next year. That is why EV/Revenue multiples are the most common multiples used when valuating software businesses, especially companies that are expanding at a rate of more than 20–30 percent annually. The higher the growth rate and the higher the gross margin, the more that the market is willing to pay.
However, revenue multiples are not used out of the blue. Qualities of that revenue are carefully observed by analysts. For subscription-based businesses, recurring revenue is more precious than revenue from a project or a single transaction or payment, especially annual revenue from recurring contracts (ARR), as it is predictable, sticky, and less likely to be swept away by competition. While the top-line might be the same, a business with $50 million in high-quality ARR is a very different beast from a business that brings in services revenue of $50 million, but that’s not recurring revenue.
What Are the Five Key Drivers That Shape a Tech Company’s Multiple?
So, when analysts are developing their opinion on what multiple to use when valuing a tech business, they are actually answering a series of layered questions about the business. The five factors that always affects that judgment are listed below.
Growth Rate: The most significant contributor to the valuation multiples is revenue growth. Even if a company has the same actual revenue, but grows at 50 percent per year, it will have an astronomically higher multiple as compared to a company that grows at 10 percent a year. Investors are buying revenue streams – and growth rate is the best indicator of revenue stream size.
Gross Margin Profile: Not all sales are created equal. A business with high gross margins indicates that the business is scalable: that is, that it can take in more customers without the costs rising proportionately. Marketplace models, cloud platforms and software businesses often command a higher gross margin, which helps them command higher valuations.
Revenue Retention: Net revenue retention (NRR) is the determination of whether the customers are spending more or less or the same with the same company over time. If the NRR is greater than 100%, the company is making money from its current customer base, just before it acquires any more, which is another indicator of a sticky, high quality product. Those companies that have a high NRR usually trade at premiums.
Addressable Market: No company can grow fast without having a large addressable market. Investors evaluate if the company is playing in a big and growing market and if the company has a defensible position in that market: defensible through technology, network effects, switching costs, or is a brand.
Path to Profitability: Every investor and acquirer expects to see a solid path to profitability, although it might be acceptable to see losses when the business has high growth. It will give companies more credibility – and with it a higher multiple – if they can explain what their unit economics are doing when they scale their business and if they can demonstrate that they are improving margins over time.
Tabele 1: Key Valuation Drivers at a Glance
| Driver | What Analysts Look For | Impact on Multiple |
|---|---|---|
| Revenue Growth Rate | Year-on-year % growth, trend direction | Very High |
| Gross Margin | % of revenue after direct costs | High |
| Net Revenue Retention | Expansion within existing customer base | High |
| Market Size (TAM) | Total addressable market in $ billions | Medium |
| Path to Profitability | Margin improvement trajectory | Medium–High |
How Do Real-World Cases Shape the Way We Think About Valuation?
Real-world examples of transactions and IPOs help to bring these concepts to life. The $27.7 billion sale of Slack to Salesforce in 2021 suggested at the time a valuation of around 26X forward revenues. That premium was justified by Slack’s high retention rates, the strategic rationale to the Salesforce ecosystem and the control premium of a negotiated acquisition. The lesson for analysts that studied the deal was that strategic buyers are willing to pay a premium when the acquisition is filling a significant piece of a business’ puzzle.
So, 2020-2021 has been a year of contrasting lessons with the wave of software IPOs and SPACs. Near-zero rates and the continued rapid adoption of digital were assumed in many high-growth technology companies’ going public valuations, which ranged from EV/Revenue multiples of 30–50x or more. Those same companies had a downward pressure of 60–80 percent on their multiples when rates jumped significantly in 2022, even with good business performance. This episode was a reminder that technology companies can’t be separated from the macroeconomic environment when valuing them. Multiples are not static; they move along with market sentiment, risk appetite and the interest rate.
There is another illustrative example here: There’s a difference between pure play SaaS companies and technology companies that enabled services. A business that offers a product that’s partly software and partly human services — also known as ‘tech-enabled services’ — will generally be offered at a lower multiple than a pure software business, as margins will be lower and revenue less scalable. That distinction can have a huge impact on valuation for software businesses, when comparing to other businesses or creating a software business valuation for a client or employer.
What Is the Valuation Process From Start to Finish?
In reality, the process for valuing tech companies is a well-defined one. This goes through a familiar series of steps, whether you’re on the M&A side, a fundraise, or a review of the portfolio.
Table 2: The Six-Step Valuation Workflow
| Step | Activity | Key Output |
|---|---|---|
| 1. Scope the Assignment | Define purpose (sale, investment, internal review) and timeline | Engagement brief |
| 2. Gather Financial Data | Gather revenue, margins, ARR, churn and retention data. | Normalised financial model |
| 3. Select Comparable Companies | Identify Public Peers by Sector, Size, Growth and Geography | Peer group list with multiples |
| 4. Run Valuation Models | Create comps, precedent transactions and DCF | Valuation range by method |
| 5. Stress-Test Assumptions | Key flexible variables (growth, margin, discount rate) | Sensitivity tables |
| 6. Triangulate and Present | Combine parts to form an ending range of output with the use of narrative. | Valuation summary or report |
One of the most frequent issues with this is the need for financial data normalisation. Businesses that are tech-based, particularly those that are venture-backed or founded, often have unique cost structures, one-time costs and/or very high capitalisation of R&D costs that need to be adjusted prior to comparable numbers being provided with public peers. One of the most common mistakes that junior analysts make is not normalising properly, resulting in apples to oranges comparisons.
One of the obstacles is choosing the proper peer group. Technology is a large industry, and a tech company shouldn’t be judged against a hardware distributor just because they both fall under “tech.Technology is a wide industry and a cybersecurity software company shouldn’t be judged on a hardware distributor, just because they both fall under tech. The closer the peer group, the more defensible the valuation. This involves true knowledge of the business model and not just a keyword search on a database.
What Are the Most Common Mistakes When Valuing Tech Companies?
Even the more advanced practitioners can end up repeating mistakes that can lead to misperceptions of the value of tech companies. It’s as crucial to know the potential mistakes as it is to know the processes.
A common error is focusing exclusively on one approach. For instance, the assumption for the terminal growth rate and the discount rate are very critical in DCF analysis. Change in either input (left side) can affect the output (right side) by 20-30 percent. The range is often very wide and unreliable when using DCF as the only method, especially for high growth businesses, where the cash flows in the near future are negative. It’s a good sanity check and a tool for testing any assumptions that may be implicit in market multiples, but it shouldn’t be used in place of market-based tools.
The other common mistake is confusing enterprise value with equity value, and when doing so, neglect to factor in the net debt, minority interest or any significant off-balance sheet items. It is particularly important in technology firms where there are significant deferred revenues on the balance sheet that help to mitigate reported revenue and that consequently can influence multiples; and/or where there are multiple venture rounds, creating an interesting capital structure.
The one thing that is most important to learn for the junior is that valuation is a persuasive process, not a technical one. What you come up with should be explainable, defensible and logically sound for someone on the other side of the table to understand and question. While the technical fluency of valuing tech companies is the basics, the ability to clearly articulate why is the difference between good and great tech analysts.
Frequently Asked Questions
Which of the following is the most common valuation technique for tech companies?
The most common approach is to do comparative company analysis using EV/Revenue multiples, especially for software and SaaS companies with comparatively limited or variable profits.
What is the impact of interest rates on valuations of tech companies?
An increase in the interest rate will lead to a higher discount rate that will lower the present value of growth businesses. That’s why the tech industry experienced multiple compression in 2022 as rates started to trend up.
What is considered to be a good valuation multiple for a SaaS business?
As a general rule, the more high growth SaaS companies (those with gross margins of 75%+ and growth of 40%+) are trading at 10-20x forward revenue in normal market conditions. This increases to 5–10 times for more mature companies.
What is the difference between public market prices and the price that acquirers pay?
Strategic acquirers pay a control premium (usually 20-40% over the current trading price) because they build synergies into the price or they value the elimination of a competitor, or the strategic fit of the acquirer into the overall business.
Conclusion: Actionable Insights for Professionals
Evaluating tech companies involves a blend of financial precision, market wisdom, and strategic understanding. The methods are of course learnable, but the skill is acquired from using them wisely in various scenarios, rather than from knowing the formulas.
If you’re a professional who’s getting better at valuing tech companies, there are three habits you should use to get better at it even quicker. Read regularly transaction announcements and public company filings first. Each deal or earnings release carries with it its valuation information and these “multiples” will be revealed, along with management’s thoughts on growth and margin outlook, that will give you more and more market intuition over time. Second, experiment with your own models and test them. It’s better to be able to modify some of your assumptions and describe why your output is what it is than it is to be able to know the “right” answer. Third, don’t ever be satisfied with your grasp of the business until you’ve landed on the numbers. The first step in software business valuation is to have a view into how your software business is making money, who your customers are, and why they are staying.
There is no formula to valuation. It is a field of study which is open to curiosity, accuracy and the ability to argue the logic. Go back to the basics, study all the deals you can get, and develop your judgement, as you work through each deal.